Open-Pit Mine Planning
At an active quarry, open-pit mining (OPM) planning is always tied to constantly changing working conditions. An excavator might go down for unscheduled repairs, a blast might shift by three days, and the haul distance might increase by half a kilometer. The effects of these changes need to be recalculated, preferably before the morning briefing.
Why the Traditional Workflow Is Labor-Intensive
SIn most companies, planning typically exists in three or four parallel worlds.
- Annual plan in one file.
- Monthly plan in Excel on the planning department head’s computer.
- Daily work orders in the mine foreman’s schedule.
- Actuals on production in dispatch reports.
- Topography and volumes in surveying software.
And when the question arises — “why did stripping drop by 10% over the week” — the process of reconciling spreadsheets begins, along with the search for where the volume was lost.
What a Unified Planning Environment Provides
System is built around two simple ideas:
- plan, actuals, equipment, scenarios, and analytics should all live in one place and be automatically recalculated together.
- The enterprise configures its own production model — stages, locations, work types, equipment, metrics, and the relationships between them. For example, a mining and processing plant and a coal strip mine will have different structures.
For a typical OPM operation, the following are usually identified:
- excavation
- drilling and blasting
- hauling
What It Looks Like in Practice
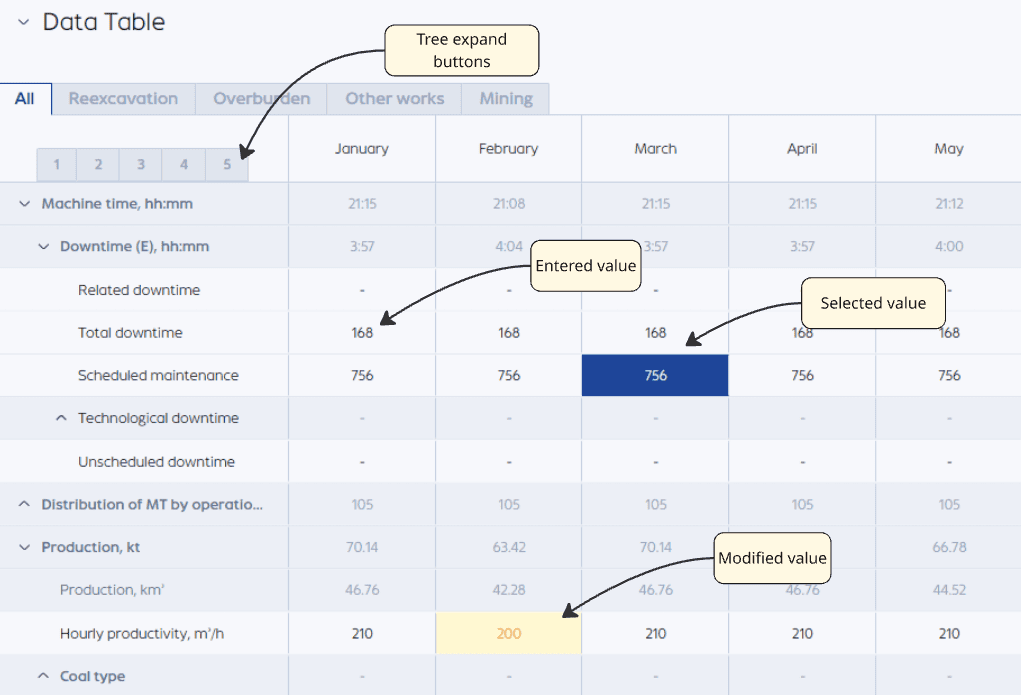
The user sees charts and dashlets at the top of the screen
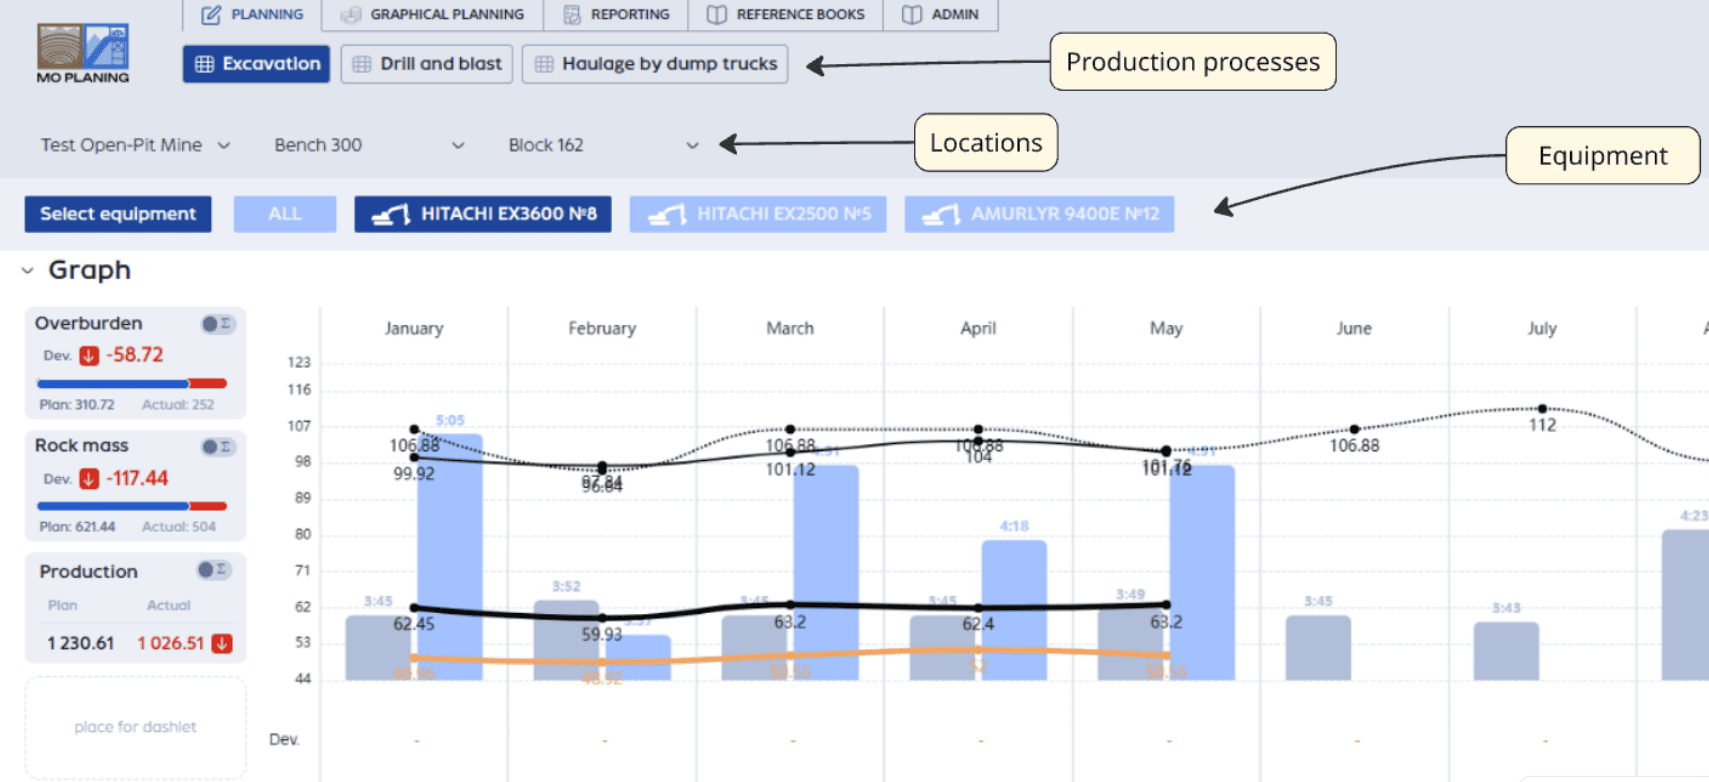
and below — a production table consisting of a metrics tree. Switching between days, weeks, months, and between plan, actuals, and scenarios happens on a single screen.
Data can be entered manually or pulled from dispatch systems.
The key point is that the system keeps the math in order on its own.
If excavator downtime is changed, the excavation volumes and the overall production metric are automatically recalculated. The monthly plan is distributed across days, and dependent metrics are updated.
Real-life example. Excavator EKG-10 went down for 6 hours due to a rope replacement. Previously, the planner would manually recalculate: how many buckets were not loaded, how this would impact the shift target and the monthly stripping plan. In PLANGR, one edit and the entire chain is recalculated in seconds.
Where Volumes Are Typically Lost
Haulage in OPM is the main source of losses.
In the system, you can configure the fleet composition and assign haul trucks to excavators. This allows you to see the utilization of each unit and compare plan vs. actuals for both work and downtime.
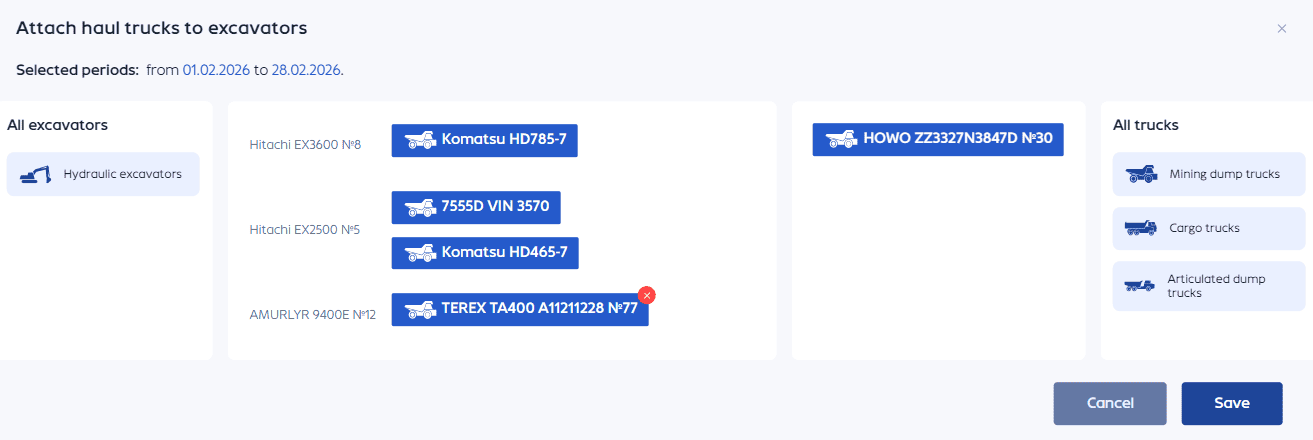
The planogram shows the overall picture of which excavators are in operation, which haul trucks are assigned to them, which work types are being performed, and which metrics are being generated. All of this is broken down by the selected period and scenario.
Factor Analysis: Why the Plan Didn’t Match the Actuals
This is arguably the most painful part of any OPM operational briefing.
System shows not just a deviation of “minus 8 thousand m³”, but breaks it down by factors: where increased downtime played a role, where productivity dropped, where the haul distance changed, where a specific crew underperformed. You can drill down through the metrics tree to a specific work type or piece of equipment.
Case study. The monthly rock mass plan was fulfilled at 97%. Factor analysis shows: 1.5% was lost due to decreased excavator productivity, 1% due to excavator downtime for maintenance and repairs, 0.5% due to relocation. From there, decisions can be made.
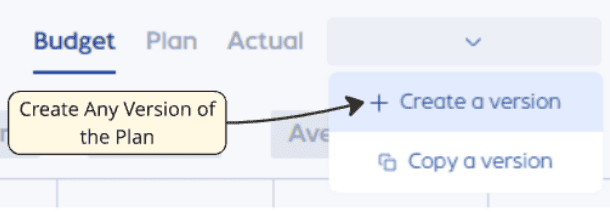
Scenarios: Calculating Consequences in Advance
Scenario planning allows you to test hypotheses before they become problems.
For example,
- What happens if two excavators are moved from the southern bench to the northern one?
- How will work execution change if a third shift is introduced?
- What would a 15% reduction in downtime yield?
- What is the effect of measures to reduce scheduled maintenance?
Graphical Planning: The Plan on the Quarry Itself
A useful tool for OPM planning is the graphical planning mode. It allows loading quarry models, displaying blocks and benches, viewing volumes for specific areas, tracking mining progress, and seeing equipment positions in space.
Production data is tied to the graphics, and the plan stops being an abstract number and becomes a specific block on a specific bench.